

A couple of interesting read about hurricanes from ProPublica and CityLab, the articles report on the cost to taxpayers to cover repeat insurance claims from wealthy home owners along the coast and expands on the environmental and socio-economic discrimination evident in the aftermath of disaster like Hurricane Florence.....
Hurricane Florence’s Surge Is Expected to Hit Homes That Already Cost the Government Millions
The storm is pummeling coastal towns that are battling rising sea levels and have been repeatedly bailed out by federal flood insurance.
Though the flooding from Hurricane Florence is predicted to be unprecedented, residents of the coastal North Carolina towns threatened by the storm surge know what it’s like to take on water. Some homes in these areas have been repeatedly flooded — and repeatedly bailed out by federal flood insurance.
ProPublica examined storm surge predictions by the National Hurricane Center, layering a map of areas expected to be affected by Florence over a map of the most flood-prone properties tracked by the Federal Emergency Management Agency, which provides most of the flood insurance for U.S. homeowners.
Critics have long argued that the program subsidizes risky development, but efforts at reform inevitably stall because raising premiums would make flood insurance unaffordable for lower-income residents. The insurance is required for federally backed mortgages of homes in flood-prone areas. The program is more than $20 billion in debt.
Looking at some of the towns, it’s easy to see why.
Severe Repetitive Loss Properties Near Florence’s Path
High-risk areas include communities along the Pamlico River and North Topsail Beach, which is on a barrier island near Wilmington. Homes there have gotten multiple flood payouts from FEMA’s National Flood Insurance Program going back as far as 1978. One property in North Topsail Beach has received nine separate payments, totaling $77,000, though the building is worth just $37,125. Another in nearby Topsail Beach has received 10 payments worth $467,000. That building is worth $300,000.
FEMA places buildings like these — including 1,132 across North Carolina — on a special list called “severe repetitive loss” structures because they’ve been flooded and rebuilt again and again with FEMA flood insurance. Properties that qualify for the list have made at least four claims of more than $5,000 each since 1978, or two claims with a combined value that’s worth more than the building itself. There are more than 35,000 such properties nationwide.
Collectively, the buildings in North Carolina are worth at least $280 million, and they’ve received $164 million in payments, according to FEMA data provided by the Natural Resources Defense Council, an environmental advocacy group. The list undoubtedly will grow after Hurricane Florence, placing additional strain on a debt-ridden program that experts say is in desperate need of reform.
The areas facing the worst impact from Hurricane Florence are among the most vulnerable in the country when it comes to sea-level rise; parts of North Topsail Beach, for instance, are eroding at 5 feet per year. And a team of scientists concluded on Wednesday that climate change had supercharged the storm — increasing its projected rainfall by roughly 50 percent and its size by 50 miles.
Rob Moore, a senior policy analyst at the Natural Resources Defense Council, said these homes are “perfect examples of what we’ll see as sea levels continue to rise.”
North Carolina has a rocky history of confronting sea-level rise. In 2012, after scientific advisers for the state predicted up to 39 inches of rising sea levels over the next century, state legislators passed a law saying North Carolina would only base policies on studies that exclusively used historical data, effectively outlawing climate science. The current governor has backtracked, and North Carolina has joined a multistate effort to tackle climate change.
Moore said the government should fund more property buyouts to permanently remove homes from risky areas. Nationwide, a majority of the homes on the list belong to low-income and middle-class residents, he said, and since buyouts often take years to process, most homeowners can’t afford to wait and are forced to use insurance claims to rebuild in the same place.
The slow-moving hurricane will linger over the Carolinas through the weekend.
We’re interested in talking to homeowners on the “severe repetitive loss” list. If you think your house is on this FEMA list, and if you’ve been affected by Hurricane Florence, please contact us at lisa.song@propublica.org or al.shaw@propublica.org.


Al Shaw
Al Shaw is a news applications developer at ProPublica.
Mapping the Unequal Burden of Hurricane Florence
Cameron Beccario is responsible for the Van Gogh of Hurricane Florence maps, created from his map of global weather conditions. While the Category 3 storm barreling toward the Carolinas won’t be pretty, Beccario’s map in all its data visualization glory is perhaps the most elegant depiction of Florence’s potential power. The screenshot below shows his weather data visualization mapped onto the earth.

A screenshot from Cameron Beccario’s weather map, which uses weather data from Global Forecast System (GFS), operated by the US National Weather Service. (earth.nullschool.net)
The reckoning, however, will not be the same for everyone in its path. Location is an obvious differentiator—but not the only one. Factors like socioeconomic status, age, whether a person has a disability, whether or not they own a car, and what languages they speak will also determine how easy or difficult it is to survive and recover from disasters like Florence.
More than 1 million people have been ordered to evacuate from the Carolinas and Virginia, but as in big storms prior, some will stay behind.
Direct Relief has created interactive maps that show the range of social vulnerability in Florence’s projected path (“social vulnerability” means the likelihood that a population will be disproportionately in need of support in an emergency). On the map below, warmer colors signify higher vulnerability; cooler colors, lower vulnerability.
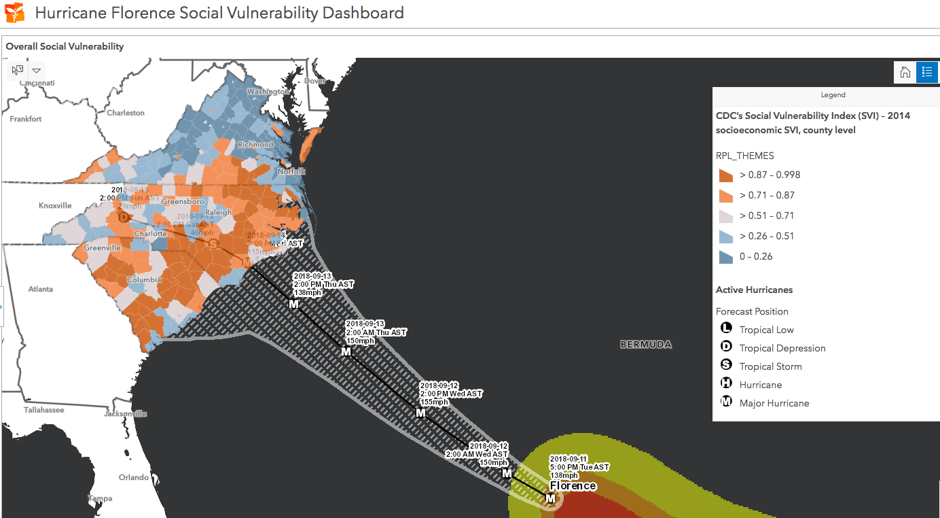
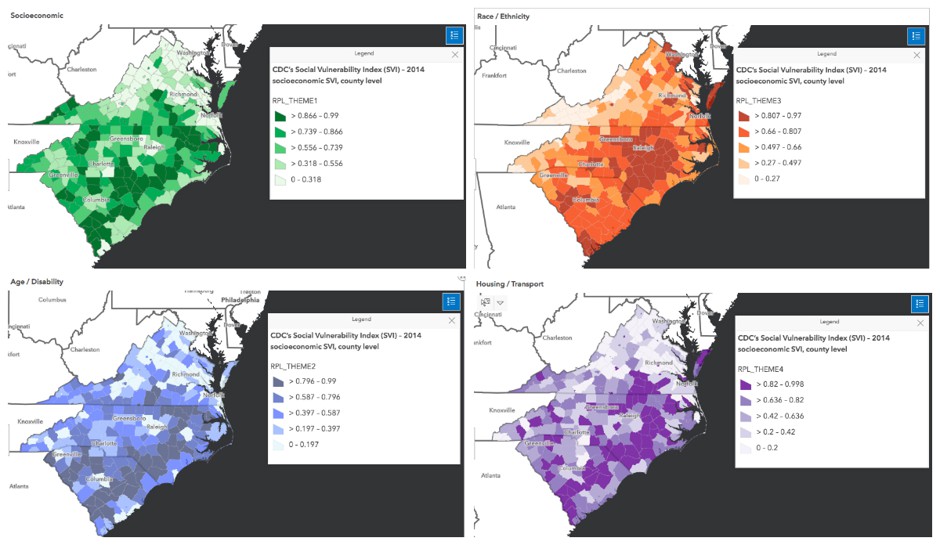
Using the CDC’s social vulnerability index, Schroeder and his team also separately analyzed and mapped, at the county and census-tract level, four key factors: socioeconomics (income and wealth) shown in green, race/ethnicity (including language) shown in orange, household composition (age and disability) shown in blue, and housing/transport (including home and car ownership) shown in purple. Darker colors signify higher social vulnerability. (You can go to Direct Relief’s Hurricane Florence Social Vulnerability Dashboardand zoom in on specific areas.)
On Direct Relief’s maps, the coast is a lighter-colored strip, meaning lower social vulnerability. People living in coastal areas of the Carolinas generally tend to be more affluent and white, said Susan Cutter, who directs the Hazards and Vulnerability Research Institute at the University of South Carolina. Areas inland from the coast have more people with lower incomes and more members of minority groups. Although the coastline will see greater damage from the hurricane’s storm surge and strong winds, inland areas will likely face extensive flooding, especially if the system stalls overhead for a couple of days.
Rising sea levels due to climate change create even more risk, Cutter said, and recent development in coastal areas will add to the toll of Hurricane Florence. “The greater the development, the less open space there is for rainfall to percolate down into the soil because everything’s paved over,” Cutter said. “So where’s the water going to go? Well, it’s going to run off and create a flood.”


Exposure change in region forecast to be affected by #Florence. 1,325% increase in the number of homes within the cone of uncertainty. While much of the development has been along the coast, most is inland and subject to flooding. The water that kills, not the wind. #HaveAPlan
On Twitter, a disaster expert at Villanova University, Stephen Strader, also noted that development can increase vulnerability to disasters for humans and their possessions—a phenomenon called the expanding bull’s-eye effect. “Humans and their possessions are targets of these geophysical hazards like hurricanes and as populations grow and development spreads across the landscape, it creates disaster potential,” Strader told CityLab.


Zoom in area of Myrtle Beach and Wilmington. While we don't know exactly where or if #Florence will make landfall, we do know that development and societal growth in this region has rapidly amplified over the last 78 years. #ExpandingBullsEye
Also, Florence is headed toward the location of America’s second-largest hog farming industry, North Carolina, according to the U.S. Census of Agriculture. The Waterkeeper Alliance revealed the potential for water contamination from the state’s high number of animal farms with its 2016 maps using data on Concentrated Animal Feeding Operations (CAFOs).
Meanwhile, as Florence bears down, North Carolina, South Carolina, Virginia, Maryland, and D.C. are under states of emergency. As of Wednesday, maximum sustained winds were at 125 miles per hour. Up to 13-foot storm surges along the coast are expected as well as 20 to 30 inches of rainfall in coastal North Carolina, producing “catastrophic flash flooding,” according to the National Hurricane Center. And as these maps show, the brunt of the storm won’t be borne equally.
About the Author

No comments:
Post a Comment